ROI Visualization
SpatialTis provides four ROI visualization methods:
Cell Map
Expression Map
Neighbors Map
Community Map
In this example I use MIBI dataset from this article:
A Structured Tumor-Immune Microenvironment in Triple Negative Breast Cancer Revealed by Multiplexed Ion Beam Imaging. To Download
For origin data, follow their instruction in the article to request it. The processed data is placed at their lab’s page. The data contains 41 patients, one ROI per patient.
[1]:
import warnings
warnings.filterwarnings("ignore", category=FutureWarning)
[2]:
import anndata as ad
import spatialtis as st
import spatialtis.plotting as sp
from spatialtis import CONFIG
data = ad.read_h5ad("../data/MIBI_data.h5ad")
data = data[data.obs['area'] < 1000].copy()
data
[2]:
AnnData object with n_obs × n_vars = 181376 × 39
obs: 'Patient', 'area', 'cell_shape', 'centroid', 'eccentricity', 'cell_type'
var: 'markers'
[3]:
CONFIG.EXP_OBS = ['Patient']
CONFIG.CELL_TYPE_KEY = "cell_type"
CONFIG.MARKER_KEY = "markers"
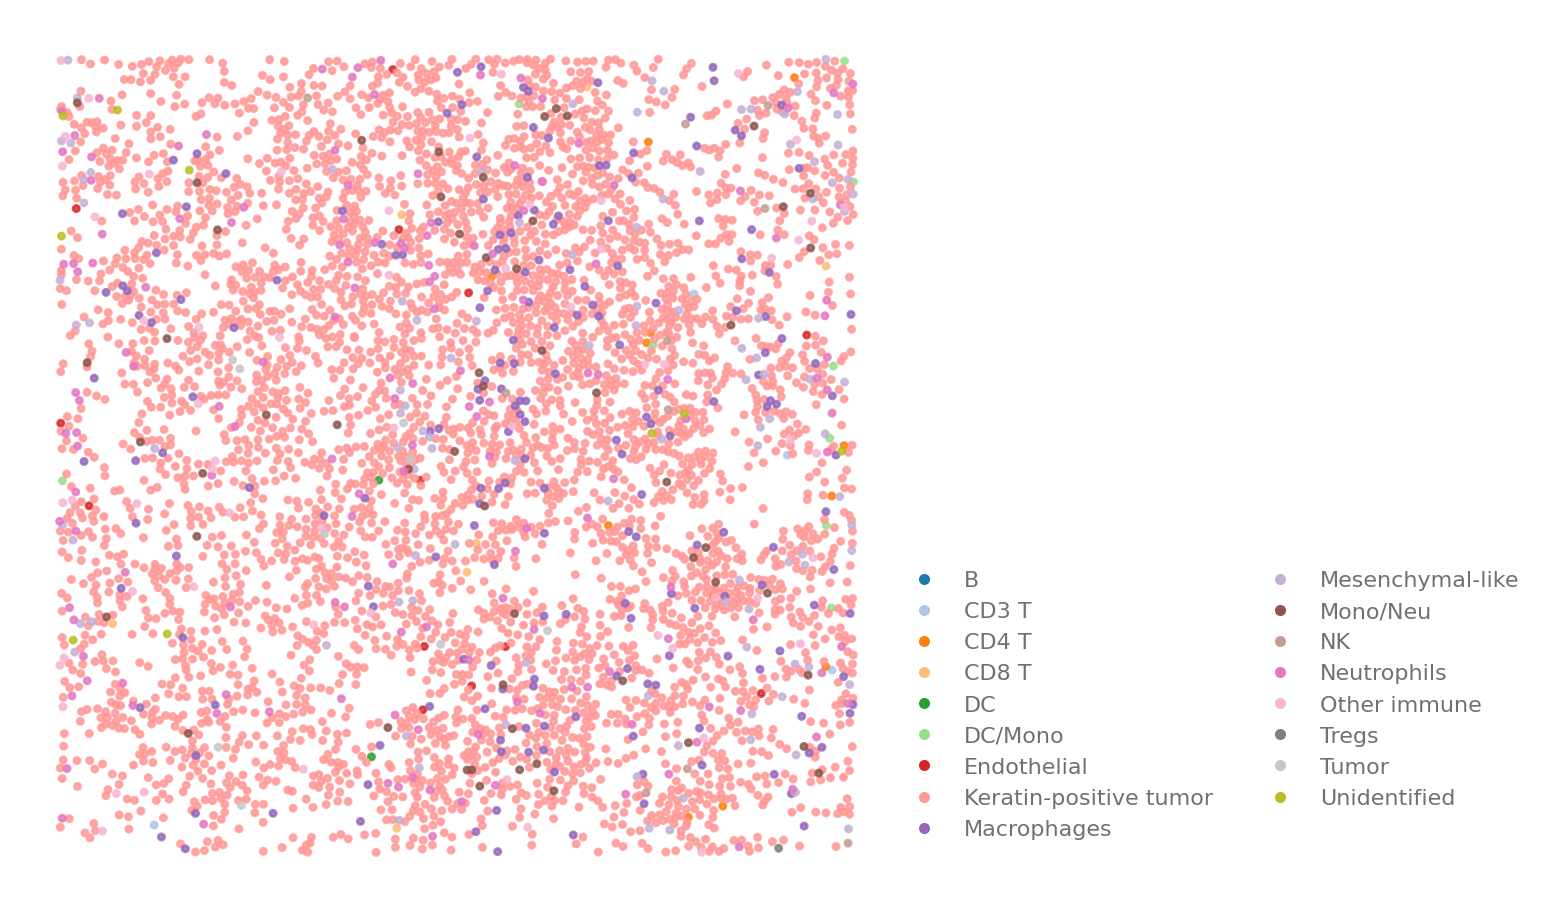
Cell Map
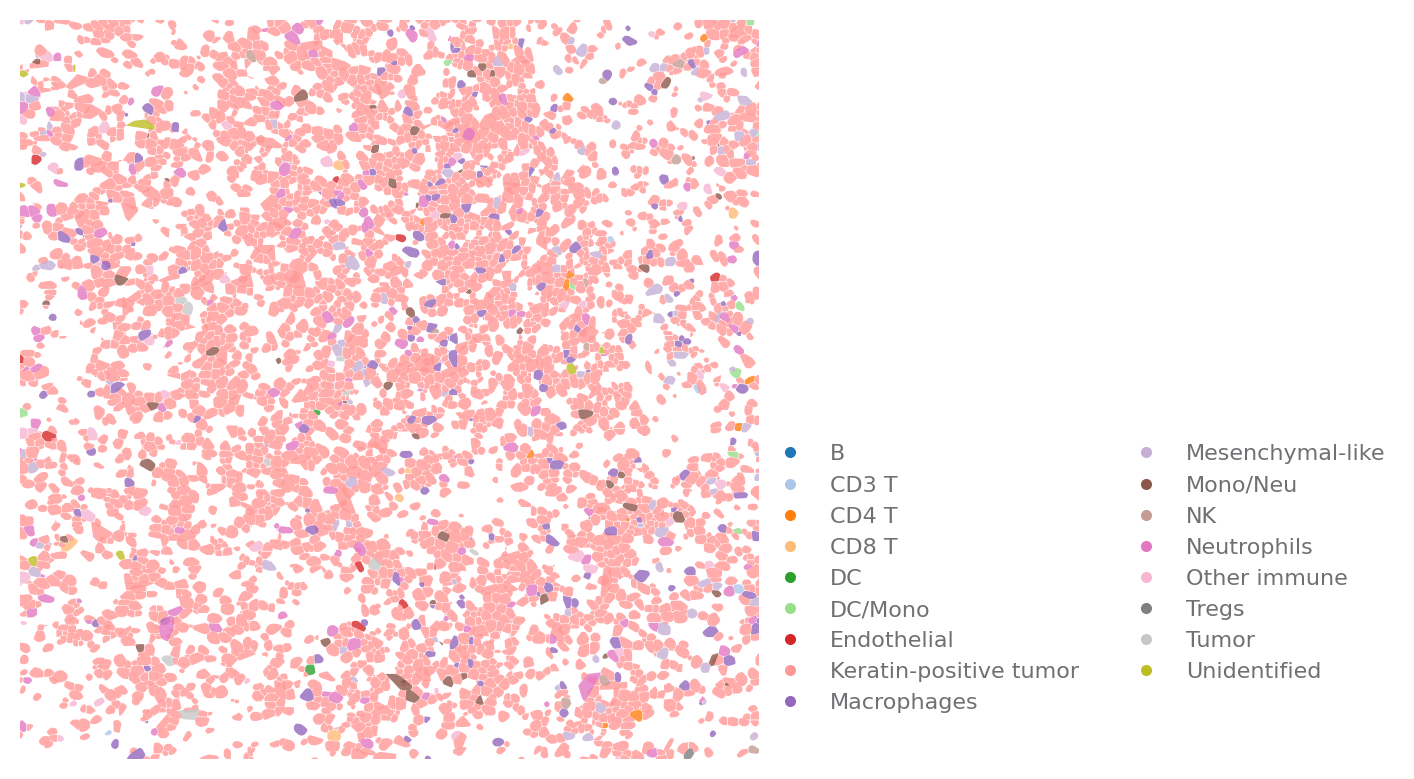
This is used to show the distribution of different type of cells in a ROI. If your cells has morphology information, the cell can be display in polygon.
You can easily see that most of the cells in the ROI are tumor cells.
[4]:
ROI = {"Patient": "Patient 21"}
sp.cell_map(data, ROI)
[4]:
For interactive plotting, you can click on the legend to mute the specific cell type
[5]:
sp.cell_map(data, ROI, use="interactive", size=(500, 700))
[5]:
[6]:
sp.cell_map(data, ROI, use_shape=True)
[6]:
[7]:
sp.cell_map(data, ROI, use_shape=True, use="interactive", size=(500, 700))
[7]:
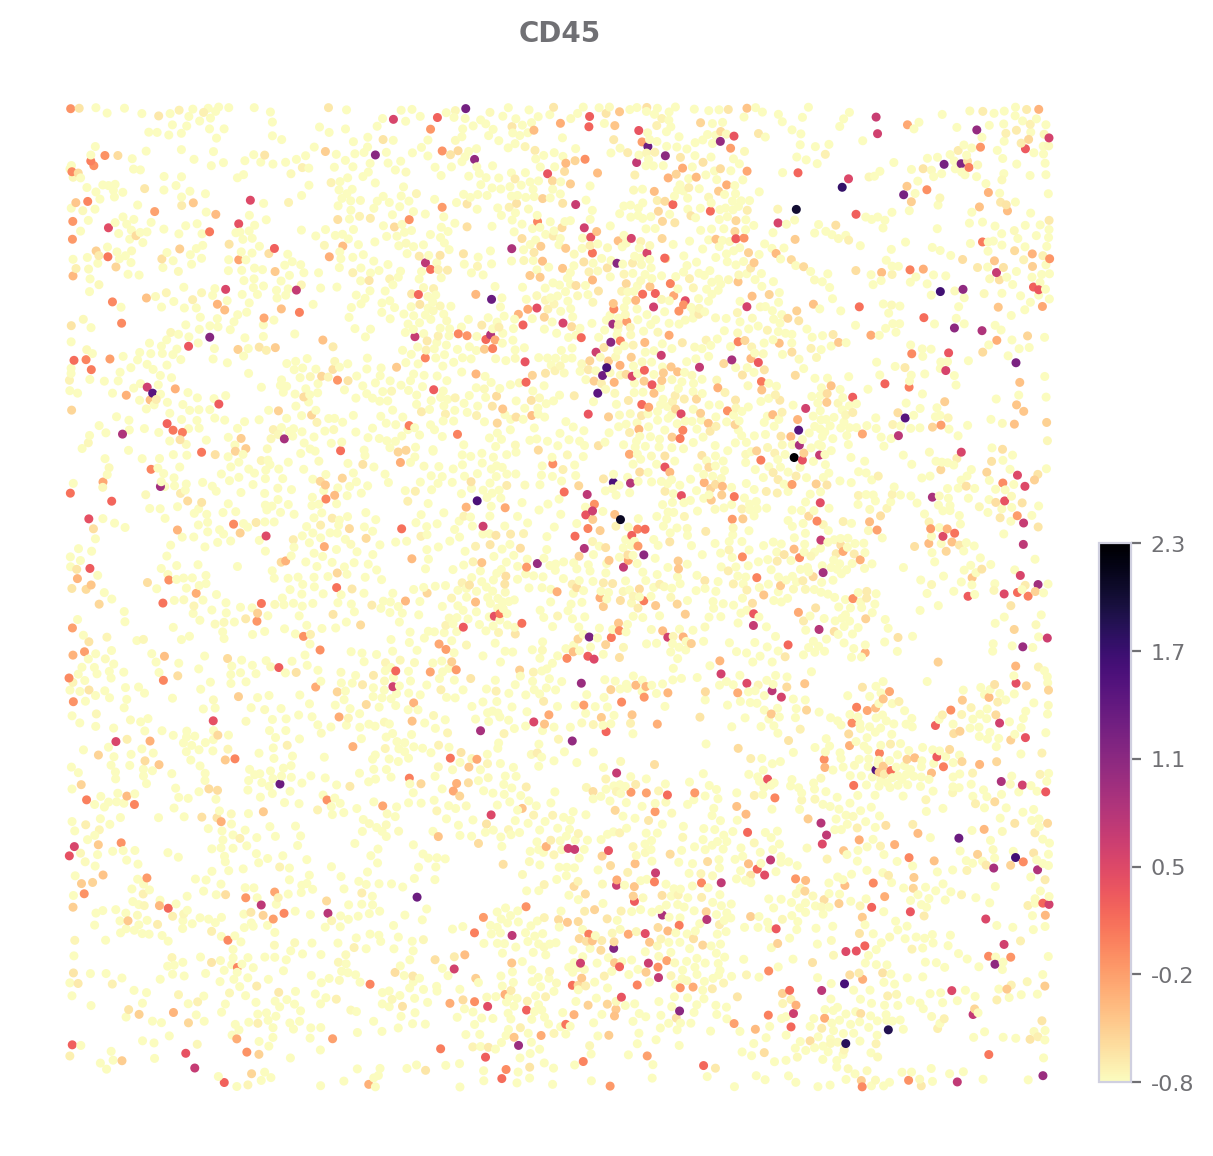
Expression Map
To show marker expression in a ROI.
Here, let’s check how “CD45” expressed.
[8]:
sp.expression_map(data, ROI, "CD45", title="CD45", size=(7, 7))
[8]:
For pyecharts’ visualization, you need to call .render(). You can also use this to rerender any visualization.
[9]:
sp.expression_map(data, ROI, "CD45", use="interactive").render()
[9]:
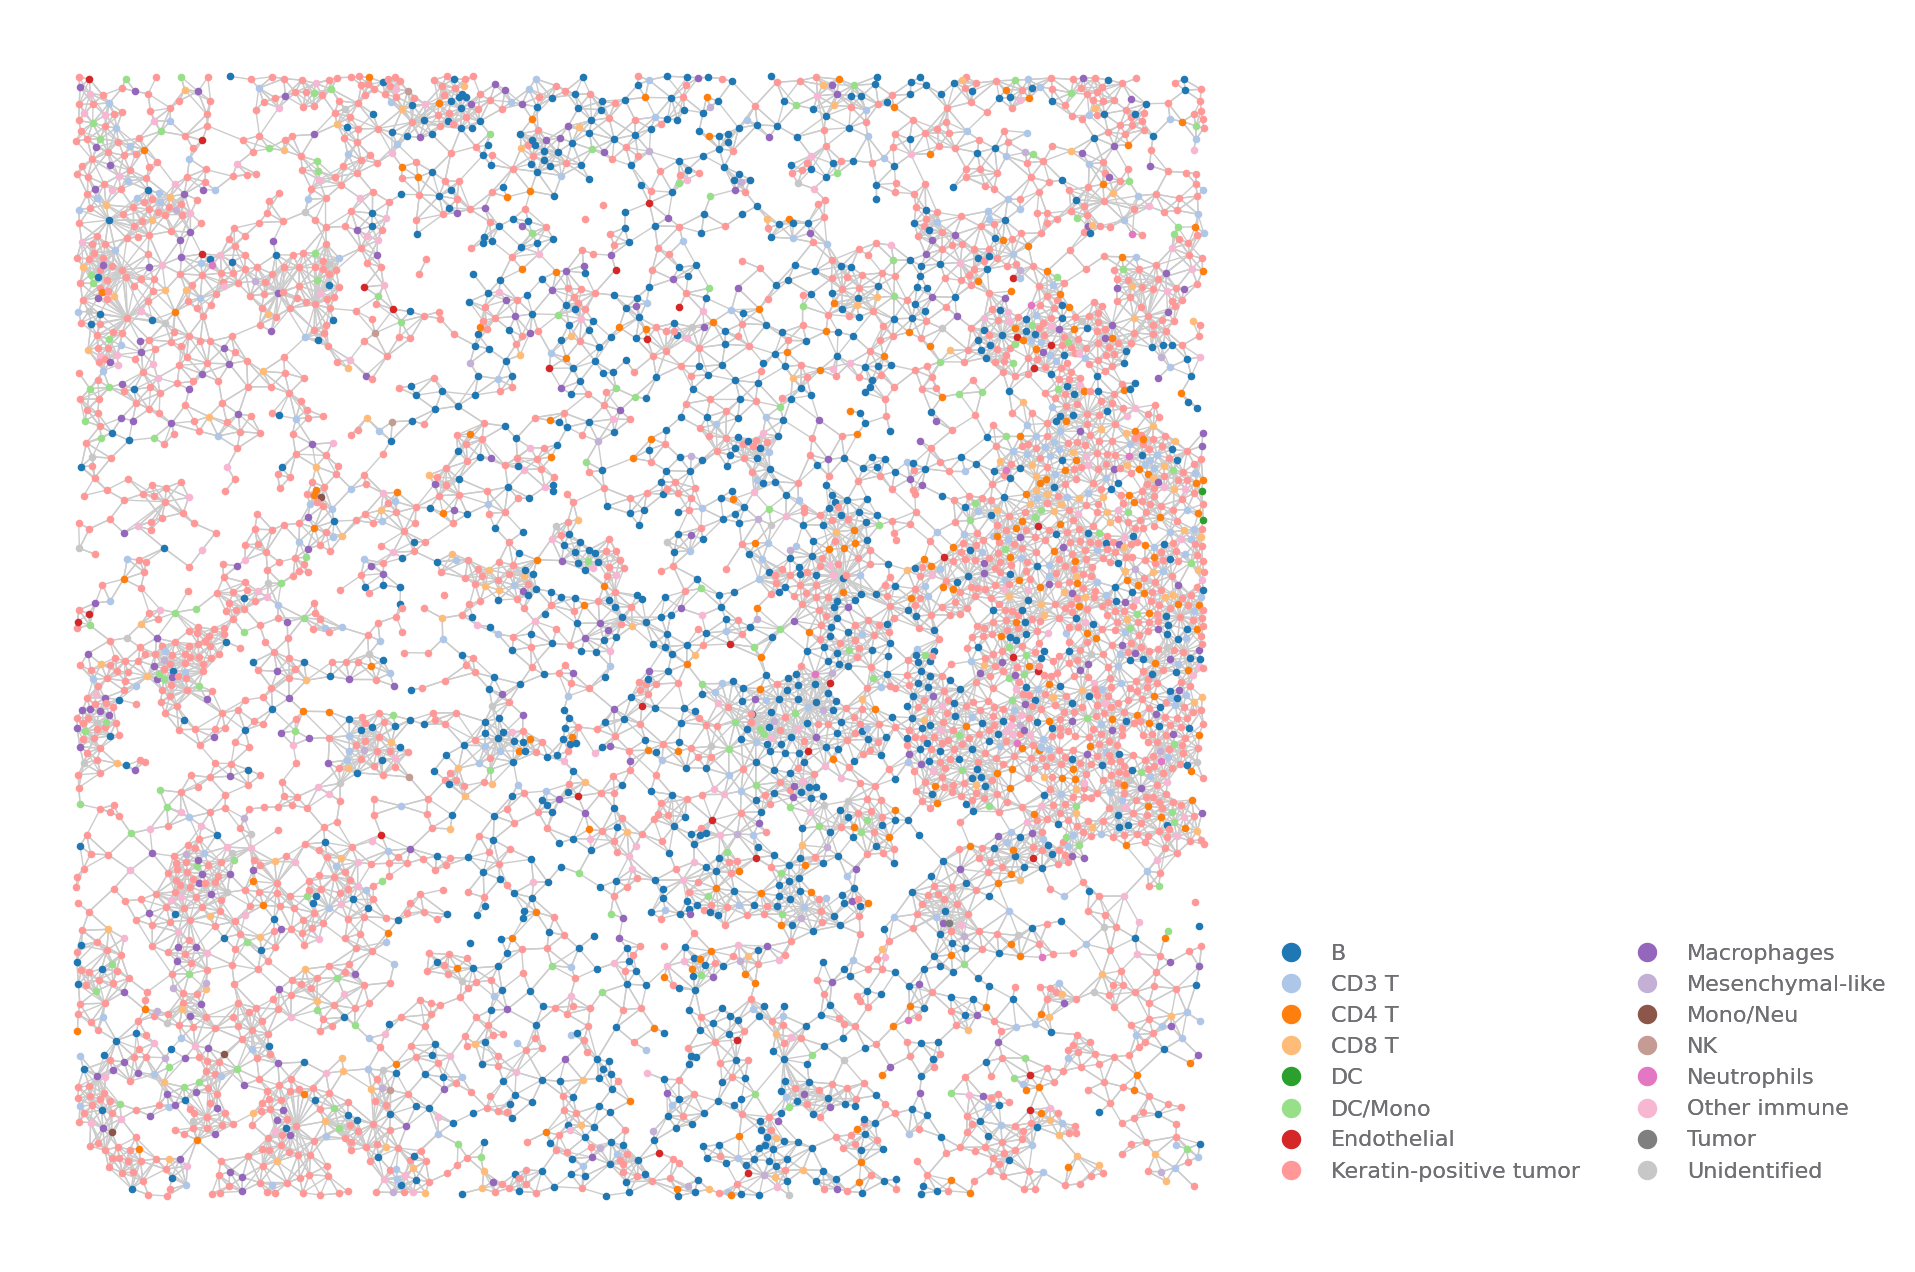
Neighbors Map
To show the neighbor relationship of cells.
You need to run the find_neighbors analysis to show the result.
[10]:
st.find_neighbors(data, use_shape=True, expand=5)
⏳ Find Cell Neighbors
🛠 Method: R-tree
Get cell bbox ██████████ 100% 00:00|00:08
Find neighbors ██████████ 100% 00:00|00:00
📦 Added to AnnData, obs: 'cell_neighbors'
📦 Added to AnnData, obs: 'cell_neighbors_count'
⏱ 9s345ms
[10]:
Rendering large ROI using matplotlib will take a long time. The pyecharts is rendering using WebGL, which is much faster.
[11]:
ROI = {"Patient": "Patient 1"}
sp.neighbors_map(data, ROI, size=(8, 8))
[11]:
[12]:
sp.neighbors_map(data, ROI, use="interactive", size=(800, 800)).render()
[12]: