Introduction to SpatialTis
What is SpatialTis?
SpatialTis is a spatial analysis toolkit for single-cell multiplexed tissue data, it use AnnData object as input.
Prerequisite
Before we going further, you need to have a basic knowledge of numpy and pandas. If you know neither, you better stop here and take 10 mins to read their tutorial. Afterwards, I’m sure you can get along well with anndata, since it’s operation is very much similar to pandas. You can read this blog to get yourself familiar with anndata.
Now that you are prepared! Let’s get started!
Using SpatialTis
Make sure you follow the code convention in your ananlysis.
spatialtis –> st
spatialtis.plotting –> sp
[1]:
import spatialtis as st
To visualize the results, you can import the plotting module
[2]:
import spatialtis.plotting as sp
Great! Now let’s load some data for analysis, throughout the tutorial, the dataset I used is from this article:
A Map of Human Type 1 Diabetes Progression by Imaging Mass Cytometry. Download the data.
For the origin data: Link to supplement materials
[3]:
from anndata import read_h5ad
data = read_h5ad('../data/imc_data.h5ad')
Let’s check what’s in our dataset
[4]:
data
[4]:
AnnData object with n_obs × n_vars = 1776974 × 38
    obs: 'area', 'eccentricity', 'islet_id', 'centroid', 'image', 'case', 'slide', 'part', 'group', 'stage', 'cell_cat', 'cell_type'
    var: 'markers'
We have 1,776,974 cells (n_obs: number of observations), 38 markers (n_vars: number of variables).
In the obs field, area, eccentricity, centroid are information of cell morphology.
cell_type, cell_cat are the cell type information,
islet_id, image, case, slide, part, group, stage are the metadata of our dataset.
Setting Global Configurations
Some of the information is used repeatively throughout the analysis. Using CONFIG can save you from typing them again and again.
Here are some of the important configurations, for more, please see the next chapter.
EXP_OBS: (Required) How you experiment data is designedROI_KEY: Which key represent the ROI (others might used “FOV”). By default, the last element inEXP_OBSwill be used.CELL_TYPE_KEY: The key of the cell type. If you only do analysis on markers, you don’t need this.MARKERS_KEY: The key of markers.
To know more about setting configurations in SpatialTis, go on to 2-Setting configurations
[5]:
st.CONFIG.EXP_OBS = ["stage", "case", "part", "image"]
st.CONFIG.ROI_KEY = "image"
st.CONFIG.CELL_TYPE_KEY = "cell_type"
st.CONFIG.MARKER_KEY = "markers"
st.CONFIG.CENTROID_KEY = "centroid"
st.CONFIG.AUTO_SAVE = "./my_result_folder" # This will automatically save your visualization
Now check your configurations
[6]:
st.CONFIG
          Current configurations of SpatialTis
┏━━━━━━━━━━━━━━━━━━┳━━━━━━━━━━━━━━━━━━━━━━━━━━━━━━━━━━━━┓
┃ Options          ┃ Value                              ┃
┡━━━━━━━━━━━━━━━━━━╇━━━━━━━━━━━━━━━━━━━━━━━━━━━━━━━━━━━━┩
│ OS               │ Darwin                             │
│ MP               │ True                               │
│ WORKING_ENV      │ jupyter                            │
│ VERBOSE          │ True                               │
│ PBAR             │ True                               │
│ AUTO_SAVE        │ my_result_folder                   │
│ EXP_OBS          │ ['stage', 'case', 'part', 'image'] │
│ ROI_KEY          │ image                              │
│ CELL_TYPE_KEY    │ cell_type                          │
│ MARKER_KEY       │ markers                            │
│ NEIGHBORS_KEY    │ cell_neighbors                     │
│ CENTROID_KEY     │ centroid                           │
│ AREA_KEY         │ area                               │
│ SHAPE_KEY        │ cell_shape                         │
│ ECCENTRICITY_KEY │ eccentricity                       │
└──────────────────┴────────────────────────────────────┘
[6]:
Since we’ve set the global configurations, you can simply run your analysis like:
st.cell_components(data)
If you don’t, you will need to repeat typing the same paramters like the following example for the rest of your analysis. However, if you suddenly want to change a configurations for just one analysis, you can simply overwrite it locally by passing paramters.
st.cell_components(data,
                   exp_obs=["stage", "case", "part", "image"],
                   cell_tpe_key="cell_cat") # overwrite the cell_type_key to "cell_cat",
                                            # without affecting the CONFIG
View your data
[7]:
import warnings
warnings.filterwarnings("ignore", category=FutureWarning)
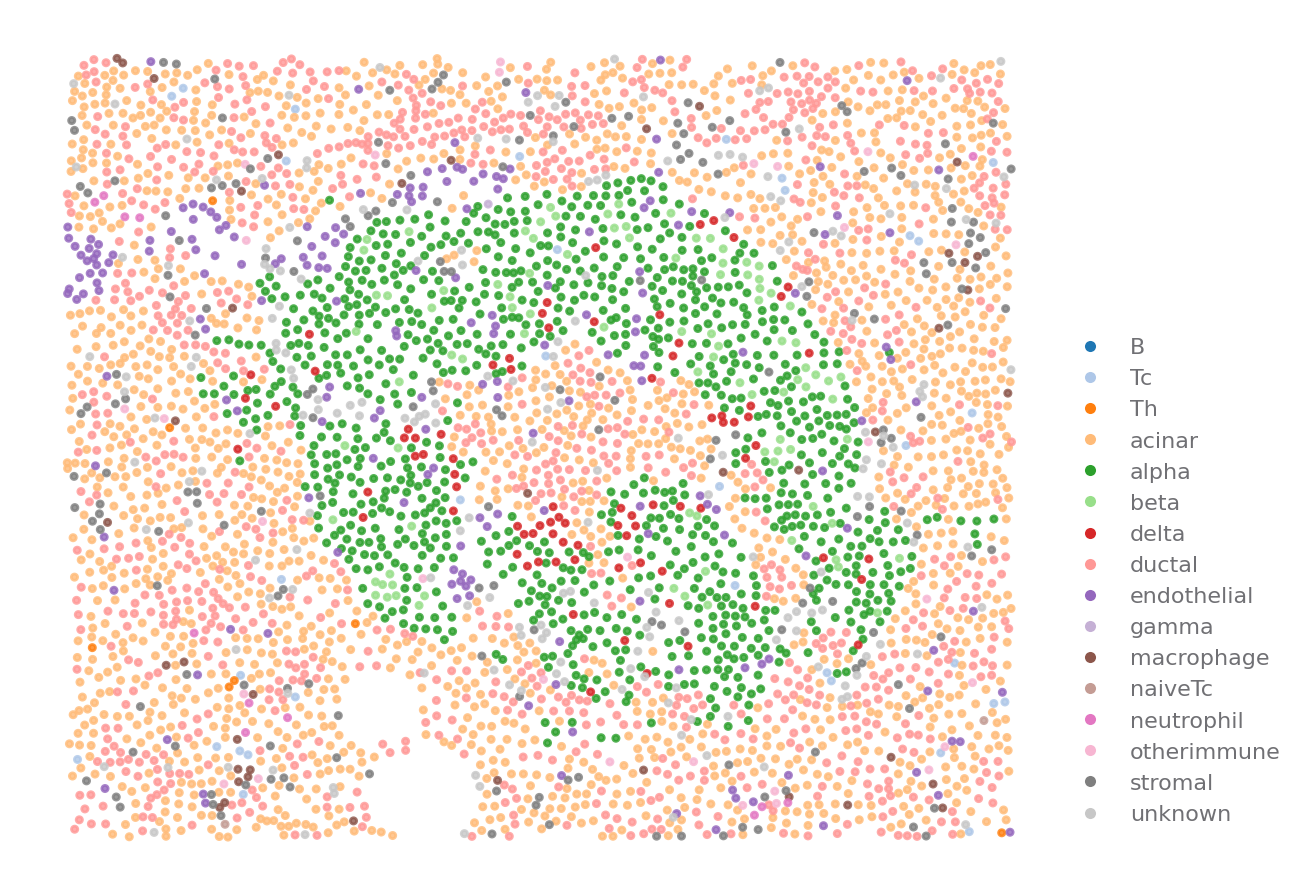
You can visualize how the cells are distributed
[8]:
ROI = {"stage": "Onset", "case": 6362, "part": "Tail", "image": "A01"}
sp.cell_map(data, ROI)
[8]:
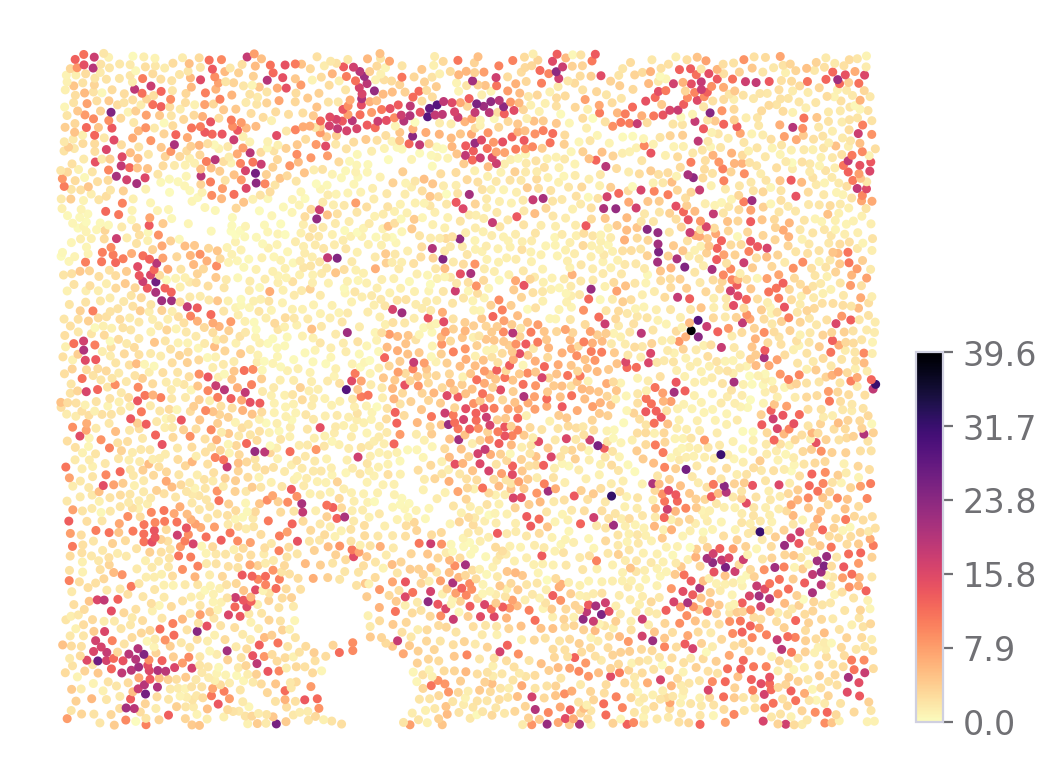
Also the markers expression
[9]:
sp.expression_map(data, ROI, "SST")
[9]:
Many plotting functions comes with both “static” and “interactive” visualization.
Put your mouse on the plot to find out what’s going on.
You need to call <code>.render()</code> for pyecharts' visualizations
[10]:
sp.cell_map(data, ROI, use="interactive", size=(400, 600))
[10]:
[11]:
sp.expression_map(data, ROI, "SST", use="interactive").render()
[11]:
Do some analysis
We can count the type of cells in different diabete stages
[12]:
st.cell_components(data)
⏳ Cell Components
📦 Added to AnnData, uns: 'cell_components'
⏱ 462ms
[12]:
To visualize the every analysis results, there is always a plotting function with same name as the analysis function.
For example: the plotting function for st.cell_components is sp.cell_components
Make sure you don’t make any typo mistake.
About customizing your visualization
You can pass following parameters, but might not work in some visualizations.
palette: The name of a color palette, or an array of color.
size: size of figure, the unit in matplotlib are inches, in bokeh/pyecharts are pixels.
title
xaxis_title / yaxis_title / legend_title
xtickslabel_rotation / ytickslabel_rotation
To customized matplotlib styles, just use
`matplotlib.rcParams<https://matplotlib.org/stable/tutorials/introductory/customizing.html>`__. The default theme here isgadfly.To customized pyecharts theme, refer to pyecharts’ themes. For non-Chinese user, used google translation to read. The english version is outdated.
To cutomized bokeh styles, please refer to their documentaion.
[13]:
islets_cells = ['gamma', 'delta', 'alpha', 'beta']
sp.cell_components(data, groupby=['stage', 'part'], selected_types=islets_cells, size=(4, 4))
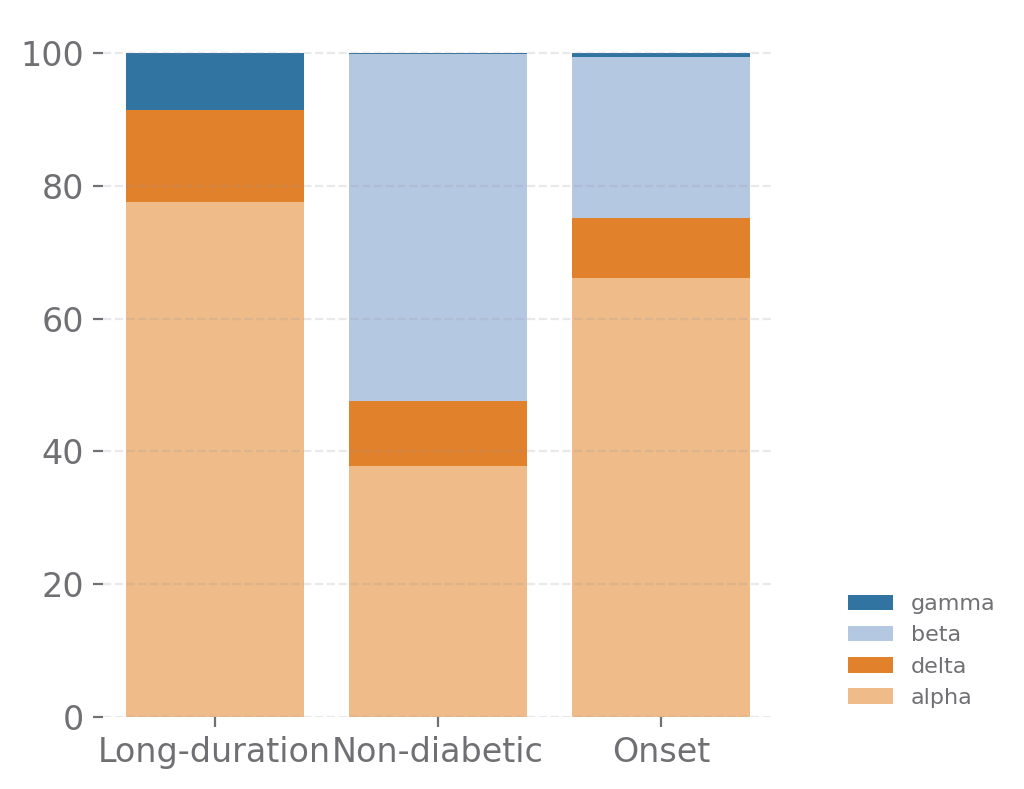
[13]:
Retrieve analysis result
You can read SpatialTis result in dataframe object for further analysis or visualization.
Method 1: Using attribute .result
[14]:
result = st.cell_components(data).result
⏳ Cell Components
📦 Added to AnnData, uns: 'cell_components'
⏱ 459ms
Method 2: Read from the anndata.uns, if you know the key that store the SpatialTis’s results
[15]:
result = st.get_result(data, "cell_components")
[16]:
result.head(5)
[16]:
| stage | case | part | image | type | value | |
|---|---|---|---|---|---|---|
| 0 | Long-duration | 6089 | Body | Q01 | acinar | 702 |
| 1 | Long-duration | 6089 | Body | Q02 | acinar | 1344 |
| 2 | Long-duration | 6089 | Body | Q03 | acinar | 863 |
| 3 | Long-duration | 6089 | Body | Q04 | acinar | 938 |
| 4 | Long-duration | 6089 | Body | Q05 | acinar | 764 |