Spatial Analysis
SpatialTis provides a series of Spatial Anlaysis methods:
Find cell neighbors
Neighbor dependent markers
Cell type based analysis:
Spatial Distribution*
Spatial Heterogenenity*
Hotspot Detection*
Neighborhood Analyisis (Cell-Cell Interaction)
* No need to compute neighbors information
Markers based analysis:
Spatial Enrichment Analysis (Markers spatial enrichemnt)
Spatial Co-expression
Spatial community detection
[1]:
import warnings
warnings.filterwarnings("ignore", category=FutureWarning)
[2]:
import anndata as ad
data = ad.read_h5ad("../data/imc_data.h5ad")
data
[2]:
AnnData object with n_obs × n_vars = 1776974 × 38
    obs: 'area', 'eccentricity', 'islet_id', 'centroid', 'image', 'case', 'slide', 'part', 'group', 'stage', 'cell_cat', 'cell_type'
    var: 'markers'
[3]:
import spatialtis as st
import spatialtis.plotting as sp
from spatialtis import CONFIG

CONFIG.EXP_OBS = ["stage", "case", "part", "image"]
CONFIG.CELL_TYPE_KEY = "cell_type"
CONFIG.MARKER_KEY = "markers"
CONFIG.CENTROID_KEY = "centroid"
[4]:
selected_markers=["INS","CD38","CD44","PCSK2","CD99","CD68","MPO","SLC2A1",
"CD20","AMY2A","CD3e","PPY","PIN","GCG","PDX1","SST","SYP","KRT19",
"CD45","FOXP3","CD45RA","CD8a","IAPP","NKX6-1","CD4","PTPRN","cCASP3"]
[5]:
st.find_neighbors(data, expand=8)
⏳ Find Cell Neighbors
🛠 Method: KD-tree
Find neighbors ██████████ 100% 00:00|00:14
📦 Added to AnnData, obs: 'cell_neighbors'
📦 Added to AnnData, obs: 'cell_neighbors_count'
⏱ 18s119ms
[5]:
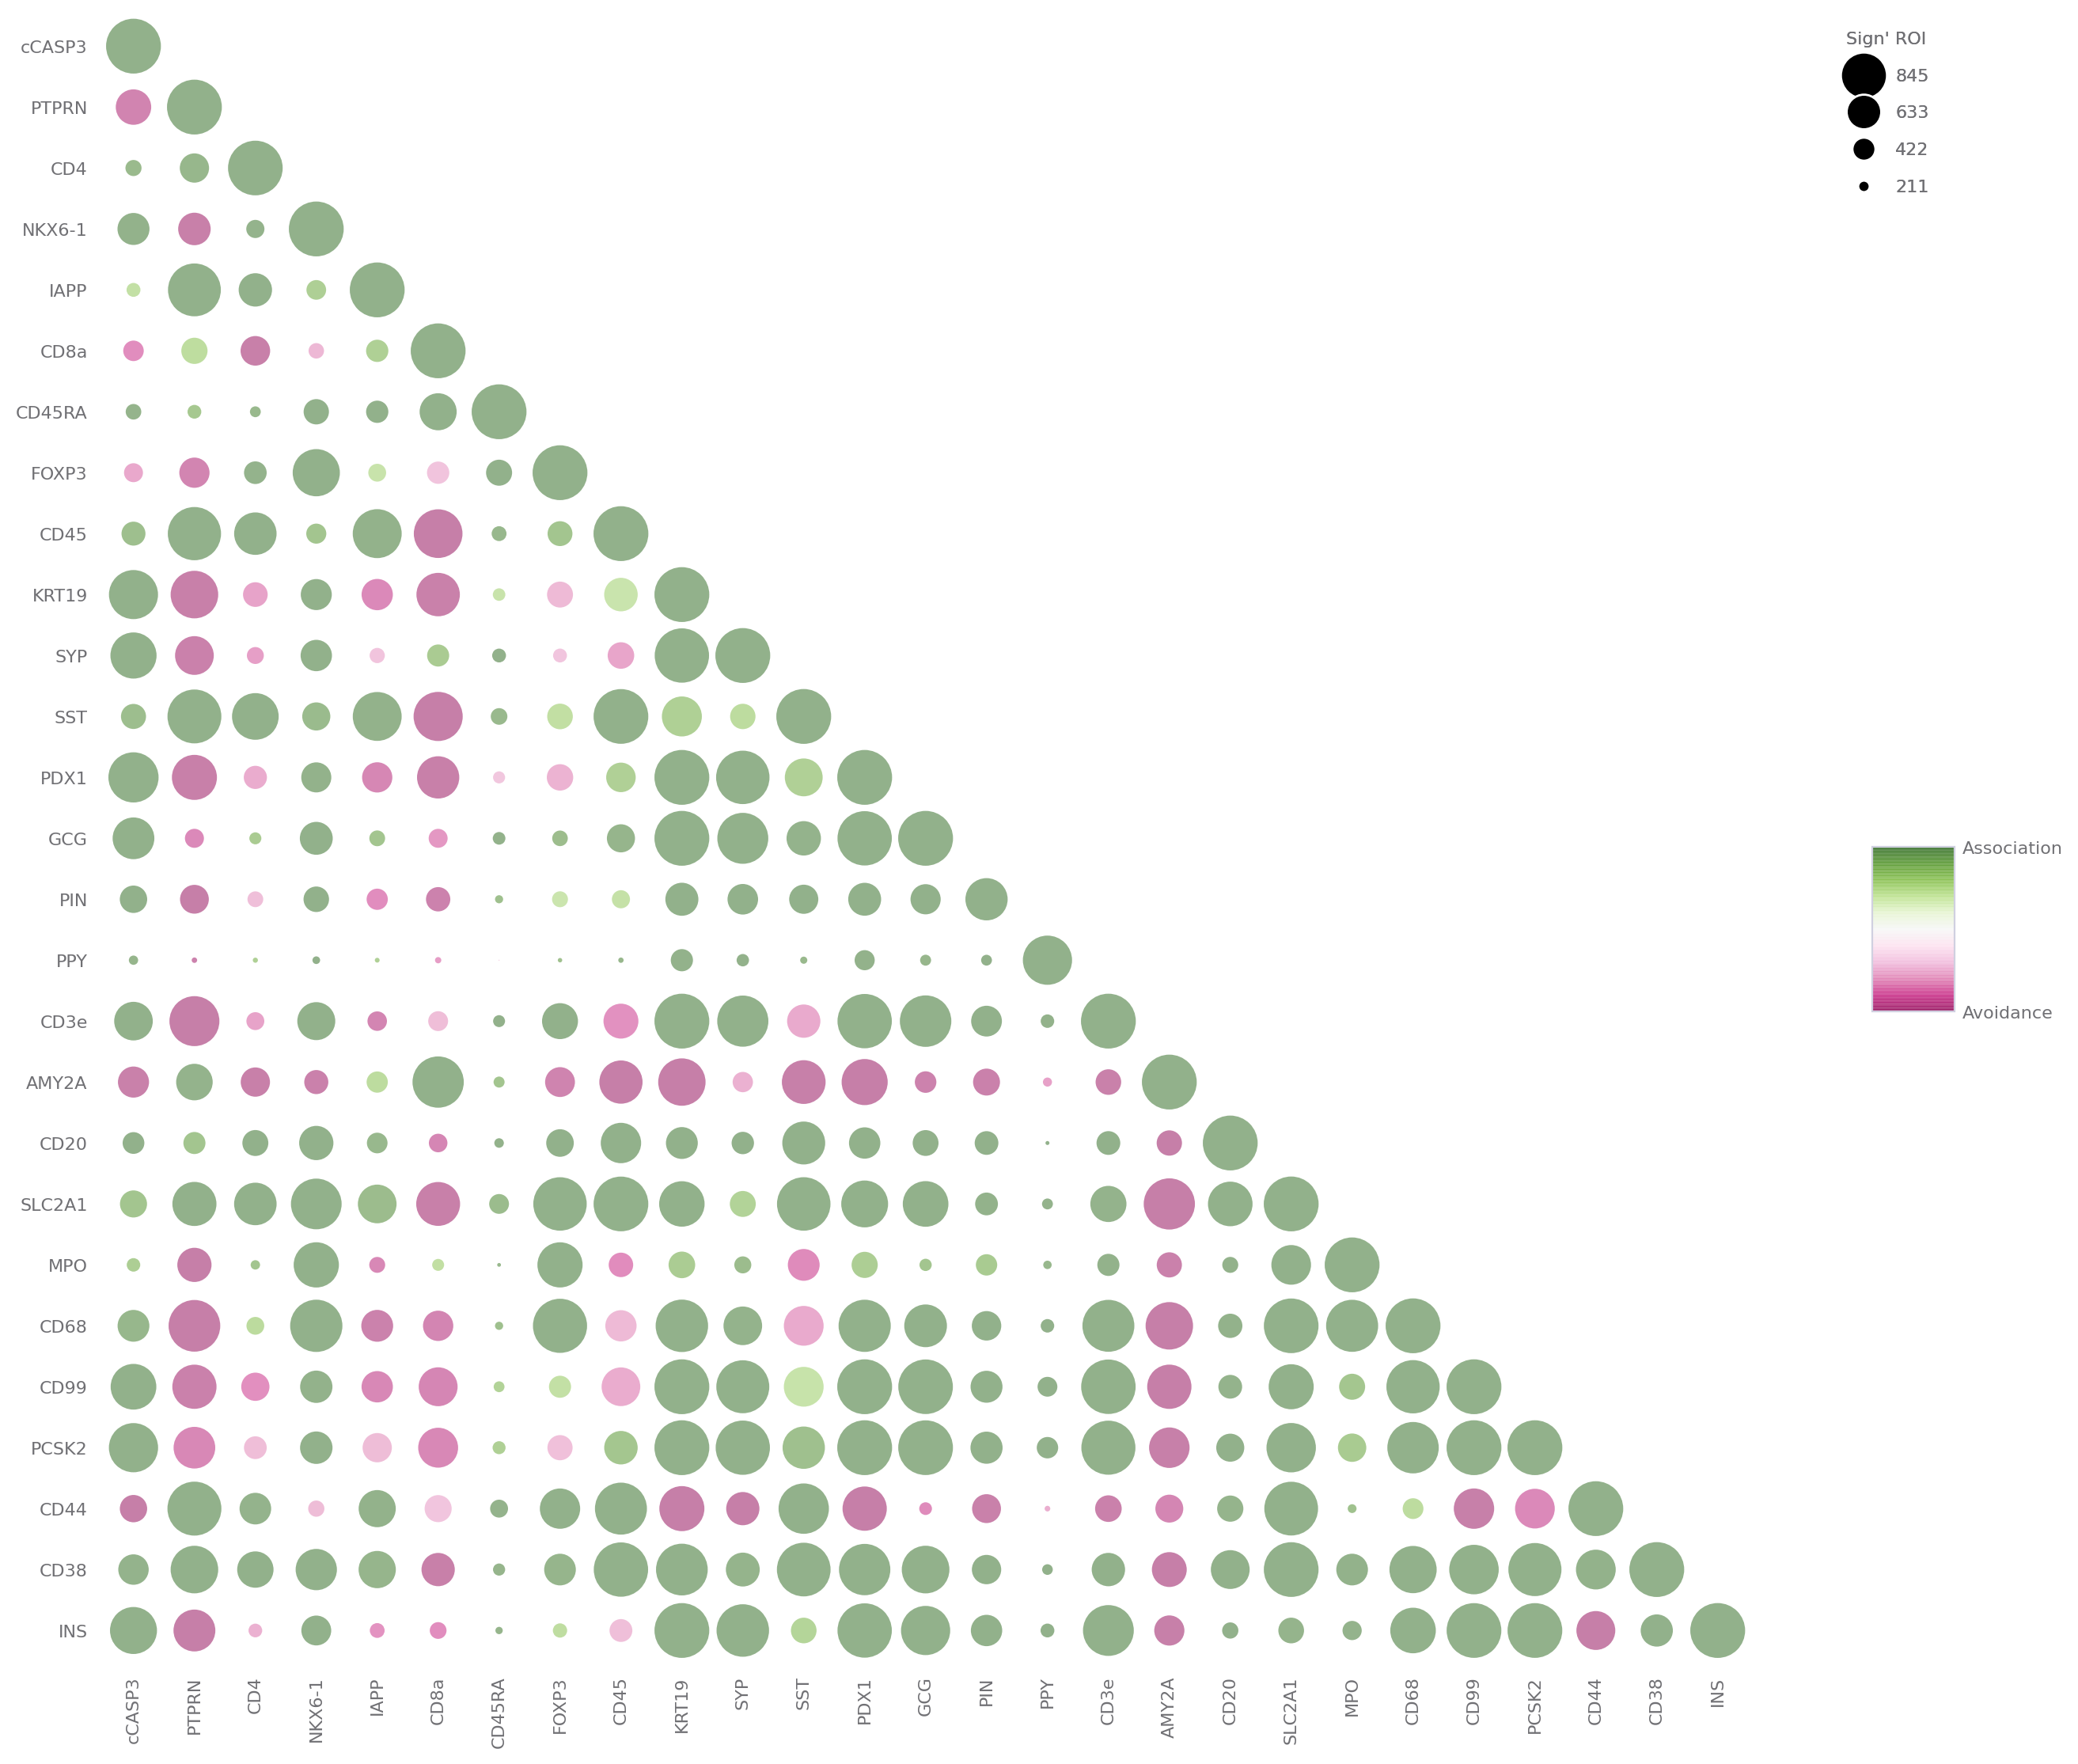
Sptial enrichment analysis
This is very similar to neighborhood analysis, to profile the interaction between markers
[6]:
st.spatial_enrichment_analysis(data, selected_markers=selected_markers)
⏳ Spatial Enrichment Analysis
Spatial enrichment analysis ██████████ 100% 00:00|13:43
📦 Added to AnnData, uns: 'spatial_enrichment'
⏱ 14m7s
[6]:
[7]:
sp.spatial_enrichment_analysis(data)
[7]:
Spatial Co-expression
[8]:
st.spatial_co_expression(data,
                         selected_markers=selected_markers,
                         use_cell_type=True,
                         exp_std_cutoff=2.0,
                         corr_cutoff=0.99
                        )
⏳ Spatial Co-expression
🛠 Method: spearman correlation
(pid=3248) /Users/milk/anaconda3/envs/spatialtis/lib/python3.8/site-packages/numpy/core/_methods.py:261: RuntimeWarning: Degrees of freedom <= 0 for slice
(pid=3248)   ret = _var(a, axis=axis, dtype=dtype, out=out, ddof=ddof,
(pid=3248) /Users/milk/anaconda3/envs/spatialtis/lib/python3.8/site-packages/numpy/core/_methods.py:221: RuntimeWarning: invalid value encountered in true_divide
(pid=3248)   arrmean = um.true_divide(arrmean, div, out=arrmean, casting='unsafe',
(pid=3248) /Users/milk/anaconda3/envs/spatialtis/lib/python3.8/site-packages/numpy/core/_methods.py:253: RuntimeWarning: invalid value encountered in true_divide
(pid=3248)   ret = ret.dtype.type(ret / rcount)
co-expression ██████████ 100% 00:00|00:00
📦 Added to AnnData, uns: 'co_expression'
⏱ 1m21s
[8]:
[9]:
sp.spatial_co_expression(data, selected_markers=selected_markers, use="graph_interactive", layout="circular").render()
[9]:
Community detection
Please refer to ROI visualization
Neighbor cell depedent markers
[10]:
st.NCDMarkers(data, use_cell_type=True, selected_markers=selected_markers)
⏳ Neighbor cell dependent markers
NCD Markers ██████████ 100% 00:00|00:35
📦 Added to AnnData, uns: 'ncd_markers'
⏱ 47s588ms
[10]:
[11]:
df = st.get_result(data, 'ncd_markers')
df = df[(~df['cell_type'].isin(["unknown", "otherimmune"])) & (~df['neighbor_type'].isin(["unknown", "otherimmune"]))].reset_index(drop=True)
df = df[(df['log2_FC'] > 2) | (df['log2_FC'] < -2)].sort_values('log2_FC', ascending=False)
df
[11]:
| cell_type | marker | neighbor_type | dependency | log2_FC | pvalue | |
|---|---|---|---|---|---|---|
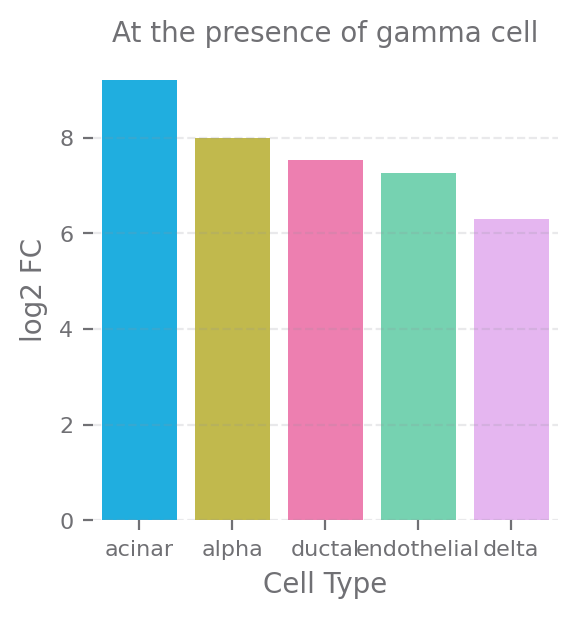
| 5 | acinar | PPY | gamma | 0.979232 | 9.197886 | 7.698006e-135 |
| 7 | alpha | PPY | gamma | 0.986381 | 7.996292 | 2.658439e-55 |
| 16 | ductal | PPY | gamma | 0.987338 | 7.530525 | 9.438925e-65 |
| 19 | endothelial | PPY | gamma | 0.989310 | 7.259280 | 2.422572e-17 |
| 13 | delta | PPY | gamma | 0.966832 | 6.299237 | 2.490482e-63 |
| 20 | endothelial | PIN | beta | 0.952361 | 4.528741 | 2.386312e-82 |
| 0 | Tc | PCSK2 | alpha | 0.623686 | 4.231225 | 5.131627e-79 |
| 23 | macrophage | PCSK2 | alpha | 0.624294 | 4.070839 | 7.595857e-32 |
| 1 | Tc | MPO | neutrophil | 0.567589 | 3.889900 | 1.999182e-68 |
| 3 | Th | MPO | neutrophil | 0.573156 | 3.352362 | 1.773463e-38 |
| 8 | alpha | PIN | beta | 0.649102 | 2.550484 | 0.000000e+00 |
| 21 | endothelial | SST | beta | 0.821855 | 2.228537 | 1.050573e-53 |
| 26 | naiveTc | PCSK2 | endothelial | 0.525751 | 2.111468 | 9.648059e-08 |
[12]:
import seaborn as sns
import matplotlib.pyplot as plt
[13]:
fig, ax = plt.subplots(figsize=(3, 3))
sns.barplot(data=df[df['neighbor_type'] == 'gamma'], y="log2_FC", x="cell_type", ax=ax)
ax.set(title="At the presence of gamma cell", xlabel="Cell Type", ylabel="log2 FC")
plt.show()
[14]:
st.NMDMarkers(data, selected_markers=selected_markers)
⏳ Neighbor marker dependent markers
NMD Markers ██████████ 100% 00:00|00:47
📦 Added to AnnData, uns: 'nmd_markers'
⏱ 50s373ms
[14]:
[15]:
st.get_result(data, 'nmd_markers')
[15]:
| marker | neighbor_marker | dependency | corr | pvalue | |
|---|---|---|---|---|---|
| 0 | CD44 | CD44 | 0.814981 | 0.508253 | 0.0 |
| 1 | PCSK2 | PCSK2 | 0.739240 | 0.527866 | 0.0 |
| 2 | CD99 | CD99 | 0.893133 | 0.587406 | 0.0 |
| 3 | MPO | MPO | 0.390161 | 0.201208 | 0.0 |
| 4 | SLC2A1 | SLC2A1 | 0.473799 | 0.444032 | 0.0 |
| 5 | PPY | PPY | 0.555188 | 0.213360 | 0.0 |
| 6 | PIN | PIN | 0.767584 | 0.316015 | 0.0 |
| 7 | PDX1 | PDX1 | 0.748424 | 0.352411 | 0.0 |
| 8 | SST | SST | 0.806502 | 0.525266 | 0.0 |
| 9 | KRT19 | KRT19 | 0.871854 | 0.561561 | 0.0 |
| 10 | PTPRN | PTPRN | 0.715619 | 0.384555 | 0.0 |
[16]: